
So it’s the usual story. You need to upgrade a machine, the IT group says, “no problem, we can virtualize it, it’ll be better! Don’t worry, yes, it’ll be fewer CPUs, but they’ll be much faster!”
So, you move forward with the upgrade. Twenty-three meetings later, 3 late nights, one OS upgrade, and two new machines forming one new cluster, you’re good. Things go live. And then Monday happens. Monday of course is the first full day of business and just so happens to be the busiest day of the week.
Users are complaining. You look at the CPU and it’s hitting 100% routinely. Things are NOT distinctly better.
You look at the CPUs and you notices something striking:

CPU 8 is showing a problem
4 of the CPUs (several are missing on this graphic) are showing virtually no utilization while the other 8 are going like gang-busters. Then it hits you, the way the IT group setup the virtual CPUs was not what you needed. They setup 6 sockets with 2 cores each for a total of 12 cores. This shouldn’t be a problem except that SQL Server Standard Edition uses the lower of either 4 sockets or 24 cores. Because your VM has 6 sockets, SQL Server refuses to use two of them.
You confirm the problem by running the following query:
SELECT scheduler_id, cpu_id, status, is_online FROM sys.dm_os_schedulers
This shows only 8 of your 12 CPUs are marked visible_online.
This is fortunately an easy fix. A quick outage and your VM is reconfigured to 2 sockets with 6 cores a piece. Your CPU graphs now look like:

A better CPU distribution
This is closer to what you want to see, but of course since you’re doing your work at night, you’re not seeing a full load. But you’re happier.
Then Monday happens again. Things are better, but you’re still not happy. The CPUs are running on average at about 80% utilization. This is definitely better than 100%. But your client’s product manager knows they’ll need more processing power in coming months and running at 80% doesn’t give you much growth potential. The product manager would rather not have to buy more licenses.
So, you go to work. And since I’m tired of writing in the 2nd person, I’ll start writing in 1st person moving forward.
There’s a lot of ways to approach a problem like this, but often when I see heavy CPU usage, I want to see what sort of wait stats I’m dealing with. It may not always give me the best answer, but I find them useful.
Here’s the results of one quick query.
Fortunately, this being a new box, it was running SQL Server 2016 with the latest version service pack and CU. This mean that I had some more useful data.
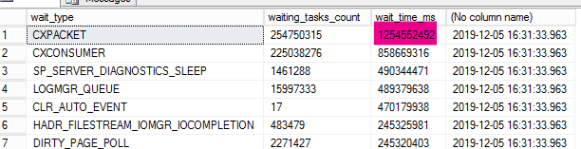
CXPackets and CXConsumer telling the tale
Note one of the suggestions: Changing the default Cost Threshold for Parallelism based on observed query cost for your entire workload.
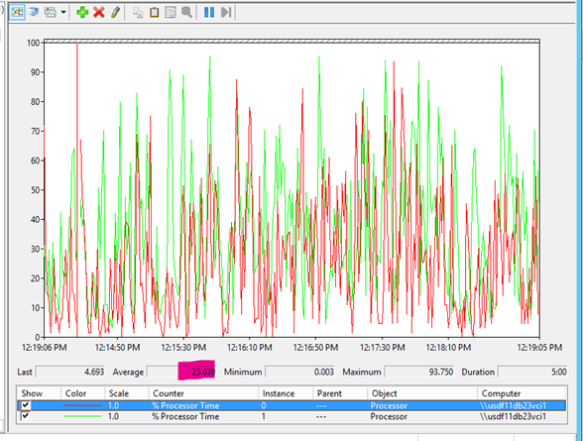
Given the load I had observed, I guessed the Cost Threshold was way too low. It was in fact set to 10. With that during testing I saw a CPU graph that looked like this:

43.5% at Cost Threshold of 10
I decided to change the Cost Threshold to 100 and the graph quickly became:
25% at Cost Threshold of 100
Dropping from 43.5% to 25.6%. That’s a savings you can take to the bank!
Of course that could have been a fluke, so I ran several 5 minute snapshots where I would set the threshold to 10, collect some data and then to 100 for 5 minutes and collect data.
| CXPacket_10 | CXPacket_10_Waittime_MS |
| 635533 | 5611743 |
| 684578 | 4093190 |
| 674500 | 4428671 |
| CXConsumer_10 | CXConsumer_10_Waittime_MS |
| 563830 | 3551016 |
| 595943 | 2661527 |
| 588635 | 2853673 |
| CXPacket_100 | CXPacket_100_Waittime_MS |
| 0 | 0 |
| 41 | 22 |
| 1159 | 8156 |
| CXConsumer_100 | CXConsumer_100_Waittime_MS |
| 0 | 0 |
| 13 | 29443 |
| 847 | 4328 |
You can see that over 3 runs the difference between having a threshold of 10 versus 100 made a dramatic difference in the total time spent waiting in the 5 minute window.
The other setting that can play a role in how parallelization can impact performance is MAXDOP. In this case testing didn’t show any real performance differences with changing that value.
At the end of the day though, I call this a good day. A few hours of my consulting time saved the client $1,000s of going down the wrong and expensive road of adding more CPUs and SQL licenses. There’s still room for improvement, but going from a box where only 8 of the 12 CPUs were being used and were running at 100% to a box where the average CPU usage is close to 25% is a good start.
What’s your tuning success story?
