
This is one of those posts where you’ll just have to trust me. Honestly.
I want to talk about indexes.
About a week ago, a friend on a chat system I use mentioned how one of their colleagues had mentioned, “oh, we don’t have to optimize the database, the server is fast enough” or words to those effect. All of us in the discussion blanched a bit. Yes, when I started in the business a 10GB database was considered large and because of the memory limit with 32-bit SQL, we were limited to 2GB (or 3GB if you took the right steps) of memory so it was literally impossible to keep a large database in memory. Of course now we routinely deal with databases 100s of GB in size with machines that can easily have .5TB of memory or more. This means except for writes, an entire database can easily be kept in memory.
But that said, optimization still matters. Last week I was debugging an ETL process that I’ve helped a client with. I’d love to show screen shots, but my NDA won’t allow me (hence my asking you to trust me). Ok, that’s partly a lie. I couldn’t provide too many details if I wanted to, but the bigger issue is, I’ve since closed the windows I that showed the scripts in questions and the results of my changes.
One of the last things each step in the ETL does is write back to the source table an updated Sales Force id. It’s actually a bit more complicated because what it really does is write to either a Success table or an Error table and depending on a factor or two, a trigger will then update the source table. I had previously debugged and improved the performance of the trigger. But something was still bothering me about the performance. I looked a bit deeper and one of the things that trigger does if there’s a success is make sure to remove the row from the Error table. This was taking longer than I suspected it should, so I dug into it and I noticed that the Error table had no index.
I can’t show the original queries I used, but I can show an example of the impact of adding a simple clustered index. (See, you can’t even trust me to say I won’t show any examples! You’d better read the entire post to verify what I’m really writing!)
Here’s an example query (with some changes to hide client specific data)
select * from ErrorTable where SF__External_Id__c='005A000022IouWqIAX'
It’s a very simple query (and simpler than the actual one I was dealing with) but is enough to show the value of a proper index.
Now, in my original query, the Query Tuning Advisor actually suggested an index on SF__External_ID__c. In the example above it didn’t. There’s a canard among many DBAs that the QTA is generally useless and often it is, though I think it’s gotten better. As a consultant, I can often come into a new client and can tell when someone has gone crazy with the QTA and adopted EVERY SINGLE suggestion. In other words, they trusted it, but they never verified it. Why is this a problem? Well at times the QTA can be overly aggressive in my experience, suggesting indices that really provide little benefit, or if you add an index in response to a select query that is run say once a day, but where there are 1000s of updates a day, you might actually slow down your updates (since now the update also has to update the index). And as mentioned above, sometimes it might fail to suggest an index. (I think in this case, it didn’t suggest one on my example because the size of the underlying table was far smaller than before).
So, I like to verify that the index I’ll add will make a difference. In cases like this, I often go old school and simply bracket my test queries
set statistics IO ON
set statistics Time ON
select * from ErrorTable where SF__External_Id__c='005A000022IouWqIAX'
set statistics IO OFF
set statistics Time OFF
And then I enable Actual Execution Plan.
The results I received without any sort of index are below. Some key numbers are highlighted in red.
SQL Server parse and compile time:
   CPU time = 0 ms, elapsed time = 0 ms.
SQL Server parse and compile time:
   CPU time = 47 ms, elapsed time = 63 ms.
SQL Server parse and compile time:
   CPU time = 0 ms, elapsed time = 0 ms.

(2 rows affected)
Table 'ErrorTable'. Scan count 1, logical reads 3570, physical reads 0, read-ahead reads 0, lob logical reads 0, lob physical reads 0, lob read-ahead reads 0.

(1 row affected)

SQL Server Execution Times:
   CPU time = 16 ms,  elapsed time = 15 ms.
SQL Server Execution Times:
   CPU time = 0 ms,  elapsed time = 0 ms.
You’ll notice the physical reads are 0. This is nice. This means everything is in memory.
In this case, because I’m familiar with how the ErrorTable is accessed I decided a clustered index on SF__External_Id__c would be ideal. (all my updates, inserts, deletes, and selects use that to access this table).
I added the index and my reran the query:
SQL Server parse and compile time:
   CPU time = 0 ms, elapsed time = 0 ms.
SQL Server parse and compile time:
   CPU time = 0 ms, elapsed time = 1 ms.
SQL Server parse and compile time:
   CPU time = 0 ms, elapsed time = 0 ms.

(2 rows affected)
Table 'ErrorTable'. Scan count 1, logical reads 3, physical reads 0, read-ahead reads 0, lob logical reads 0, lob physical reads 0, lob read-ahead reads 0.

(1 row affected)

SQL Server Execution Times:
   CPU time = 0 ms,  elapsed time = 0 ms.

SQL Server Execution Times:
   CPU time = 0 ms,  elapsed time = 0 ms.
Note the number of logical reads dropped by about a factor of 1000. My elapsed time dropped from 15 ms to 0 ms (or rather less than .05 ms so SQL Server rounded down).
If we look at the graphical query plan results we something similar:
First, without the index:
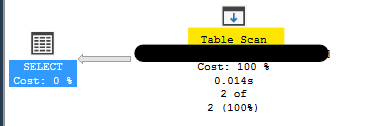
Table scan to find 2 rows

Table Seek to find 2 rows
That’s nice, I now know I’m doing a seek rather than a scan, but is that enough? I mean if the ErrorTable only has 2 rows, a seek is exactly the same as a scan!
So let’s dig deeper:

Query plan showing details for a scan

Query plan showing details for a seek
Here you can definitely see the dramatic improvement. Instead of reading in over 100,00 rows (at a bit over 2.5 KB per row, or over 270MB) we only need to read in 2 rows, for a total of just over 5 KB of data.
Now wonder it’s faster. In fact, in the ETL process where it was originally taking about 1 minute to process 1000 rows, my query with the index was now executing 3000 rows in under 10 seconds.
The above is a bit of a contrived example, but it’s based on actual performance tuning I did last week. And this isn’t meant to be a lesson in actual performance tuning, but more to show that if you make a chance (in this case adding an index) you can’t just trust it will work, but you should VERIFY that it has made a difference, and more importantly, that it makes a difference for your workload. I’ve seen GTA often make valid, but useless index suggestions because someone ran an uncommonly used query against it and assumed the recommendation was good. Or, they’ve made assumptions about the size of the table.
So never just trust an index will help, but actually VERIFY it will help.

Pingback: “We want information…information… information!!!” | greenmountainsoftware
Pingback: … Other Duties as Assigned #2 in a series | greenmountainsoftware