
It’s never a good thing when you get an impromptu meeting invite on the weekend and the subject line is “Sync Error”. I honestly didn’t even see the invite until the meeting had been going on for over an hour.
I called in and was brought up to speed. A 3rd party tool one of my client uses was having major timeout issues. Normally it’s fine, but my client was taking advantage of the weekend to do a very large import of data and the tool wasn’t keeping up.
I both love and hate being thrown into situations like this. I hate it because often I have very little information to go on, but also love it, because it can be a good challenge. So, I wanted to collect some data. Fortunately the database in question runs on SQL Server 2016. This blog post covers a bit of what we did and ends with why I am so grateful for Query Store.
Query Store and the First Graphs
I quickly enabled Query Store and grabbed a quick report. Based on help with the 3rd party support, I was able to focus on a particular query.
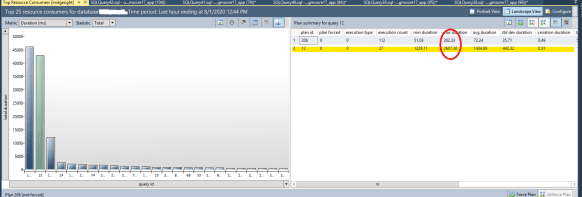
Initial Query Store screen grab
So, right away, I knew that at times this query could flip to a pretty bad query plan. I was curious as to why. But while poking around, I noticed something else going on. The database was at the SQL Server 2008 compatibility level, despite running on SQL Server 2016. Now I know when we upgraded the server a year ago the 3rd party vendor didn’t guarantee compatibility with 2016, so we had left it in its old compatibility level. Since then apparently the vendor had qualified it and I confirmed with their support who was on the line that I could change the compatibility level to SQL Server 2016. Of course, I wanted to see if this would make a difference, so I grabbed another one of the problematic queries and looked at the query plan both before and after.

Query Plan at SQL Server 2008 Level
Query Plan at SQL Server 2016 Level
As you’ll note, the 2008 plan uses 2 hash matches, the 2016 uses two merge joins. That’s interesting by itself, but after collecting a bit of data, I saw the 2016 plan was running in an average of 45ms. The 2008 plan had been averaging 1434ms. That’s quite the improvement, simply by a single change!
That said, I still wasn’t entirely comfortable with what was going on and dug a bit deeper.
Digging Deeper
The change to the compatibility level had essentially eliminated the green bar in the above graph. This was good. But the blue bar to the left of it was still an issue. It also had a similar issue with flipping between two different query plans, but this was even worse.
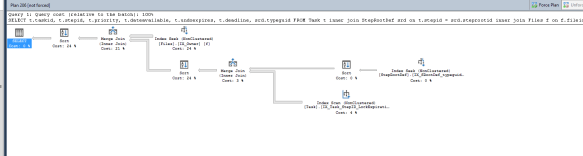
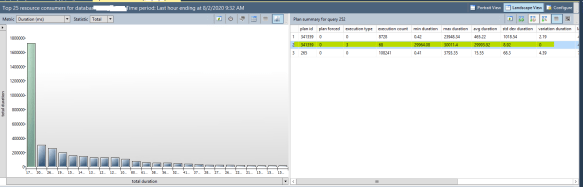
Better, but not that one query really stands out!
I find this particular chart to be the most useful. I set a custom time frame (in this case 3 hours) and looked at the total duration of 25 queries that had accumulated the most time running. It’s pretty clear that one query dominates and working on this is probably where I want to spend my efforts. It’s also very hard to pick out, but the query (#12) from the first graph that I had looked at, has improved so much that it’s now moved to 12th on the list from the 2nd position. That’s quite an improvement and simply by changing the compatibility level! More on my thoughts on that below.
The more I thought about it, the more I started to focus on statistics. This was an educated guess based on the fact that my client was doing a LOT of inserts and updates into a particular table. There’s another issue I’ll also discuss. This one I couldn’t fix unfortunately, but if the 3rd party can, I think they’ll see a HUGE improvement in performance.

Slow version of the query
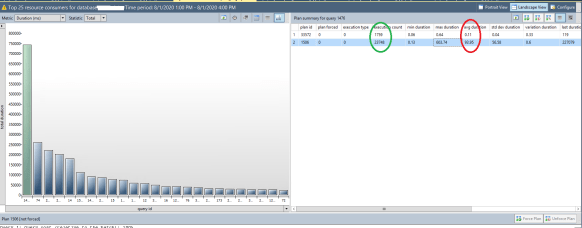
Fast version of the query
These look VERY similar, except the position of the Key lookups and the Index Seeks are swapped. That may not seem like much but the slow version was on average taking about 93.95 ms and the fast version was on average taking about .11ms. That’s a HUGE difference, about 850x difference! It took me a bit to realize what was going on, but let’s talk about that Key lookup. Even with the faster version, it’s obvious that if I can eliminate that, I could get things to be even faster! The problem is that the query wants to return some columns not covered in the IX_FileID index. That’s generally easy to fix and while I’m loathe to make updates to 3rd party packages, I was willing to test this one out by making it a covering index. Unfortunately, this is where I was stymied. One of the columns is an IMAGE datatype and you can’t throw those into an index. I’ve recommended to the 3rd party vendor they try to change this. It wouldn’t be easy, but it could have dramatic performance improvements here and elsewhere (I had run into this problem last year while trying to tackle another performance issue).
I should note, that even though this query is actually very fast, it is executed so much that its total time dominates in the system. This is one reason why any improvement here would have a dramatic impact.
Statistics
In any case, looking at these two query plans and doing some further testing confirmed my hypothesis and also suggests why changing the compatibility level helped so much: statistics were very quickly getting out of whack.
I was able to confirm this by grabbing some data from the query store for just the last hour and it showed only the slow version of the query was running. I then forced an update of stats on the table in question and immediately saw the query flip over to the faster plan. This continued for awhile before it flipped back to the slower version.
We developed a plan, which I’ll admit upfront didn’t work. We decided that updating the stats on that particular table every hour might give us tremendous performance gains. And in fact it did initially. BUT, what we found was that after an hour of inserts, running the update stats for that table took about 45-60 seconds and the vendors tool has a hard-coded 30 second timeout. And because of the way this particular tool works, it means after a failure you have to start from scratch on every run. Since the job can take 4-6 hours to run, we couldn’t update stats every hour, even though I would have liked to.
The graph that should our plan wasn’t working
Above shows how at the time the update stats was running (that particular column of the query story graphic is cut off) the query times jumped to 30 seconds. So while overall updating the stats is a good thing, here it was definitely killing our process.
Above I mentioned that changing the compatibility level still had an impact here. What I didn’t show here was that I was also looking at a bunch of statistics histograms and could see how badly things had gotten in some cases. But this is an area where SQL Server 2016 makes a difference! It can do more in the background better to help keep statistics a bit more accurate (still not as good as a full update, but it can dramatically help.) This is a hug part I believe of why the first query addressed above improved AND stayed improved.
Loving Query Store
They say a picture is worth a 1000 words. Honestly, I probably could have figured out the above issues with running a bunch of queries, looking at some DMVs, statistics histograms and the like. But it would have taken longer. Note too you can query the query store. But, the ability to instantly look at a graph, see what’s taking the most time, or executing the most, or a variety of other parameters makes the graphical interface to Query store EXTREMELY valuable. I was able to instantly zero in on a couple of key queries and focus my energies there. By varying the timeframes I was looking at, I could try changes and see the impact within minutes. I could also look at the stored query plans and make judgments based on what they showed.
If you’re NOT using Query Store to debug performance issues, start doing it. To be honest, I haven’t used it much. I wouldn’t call myself an expert in it by any means. But, I was able to pull it up and almost instantly have insight into my client’s issues and was able to make actionable suggestions.
And to quote the product manager there after I fixed the first query simply by changing compatibility mode, “A good DBA is like having a good mechanic to work on your car.” That one made me smile.
Oh and I’ve been known to swap out the alternator on my old Subaru in under 10 minutes and have replaced the brakes a number of times. So if this DBA thing doesn’t work out, I guess I’ve got another career I can look into!
Final Note
Per my NDA, I obviously haven’t named my client. But also, simply out of respect, I haven’t named the third party tool. I don’t want folks thinking I’m trying to besmirch their name. Their product is a fine one and I’d recommend it if asked. But my client is one of their larger users and sometimes pushes it to the limits so we sometimes find some of the edge cases. So nothing here is meant to disparage the 3rd party tool in an way (though they should replace that image field since it really doesn’t need to be one!)
